
History
A calendar view of every day in your tracking timeline, color-coded by what you completed.
The History page shows a month-by-month calendar of every day in your tracking timeline. Each day is a coloured square: grey for no activity, blue for a day where rituals were completed, yellow for partial activity, and green for a fully complete day with both rituals and daily targets done. Days outside an active Arc may show in red.
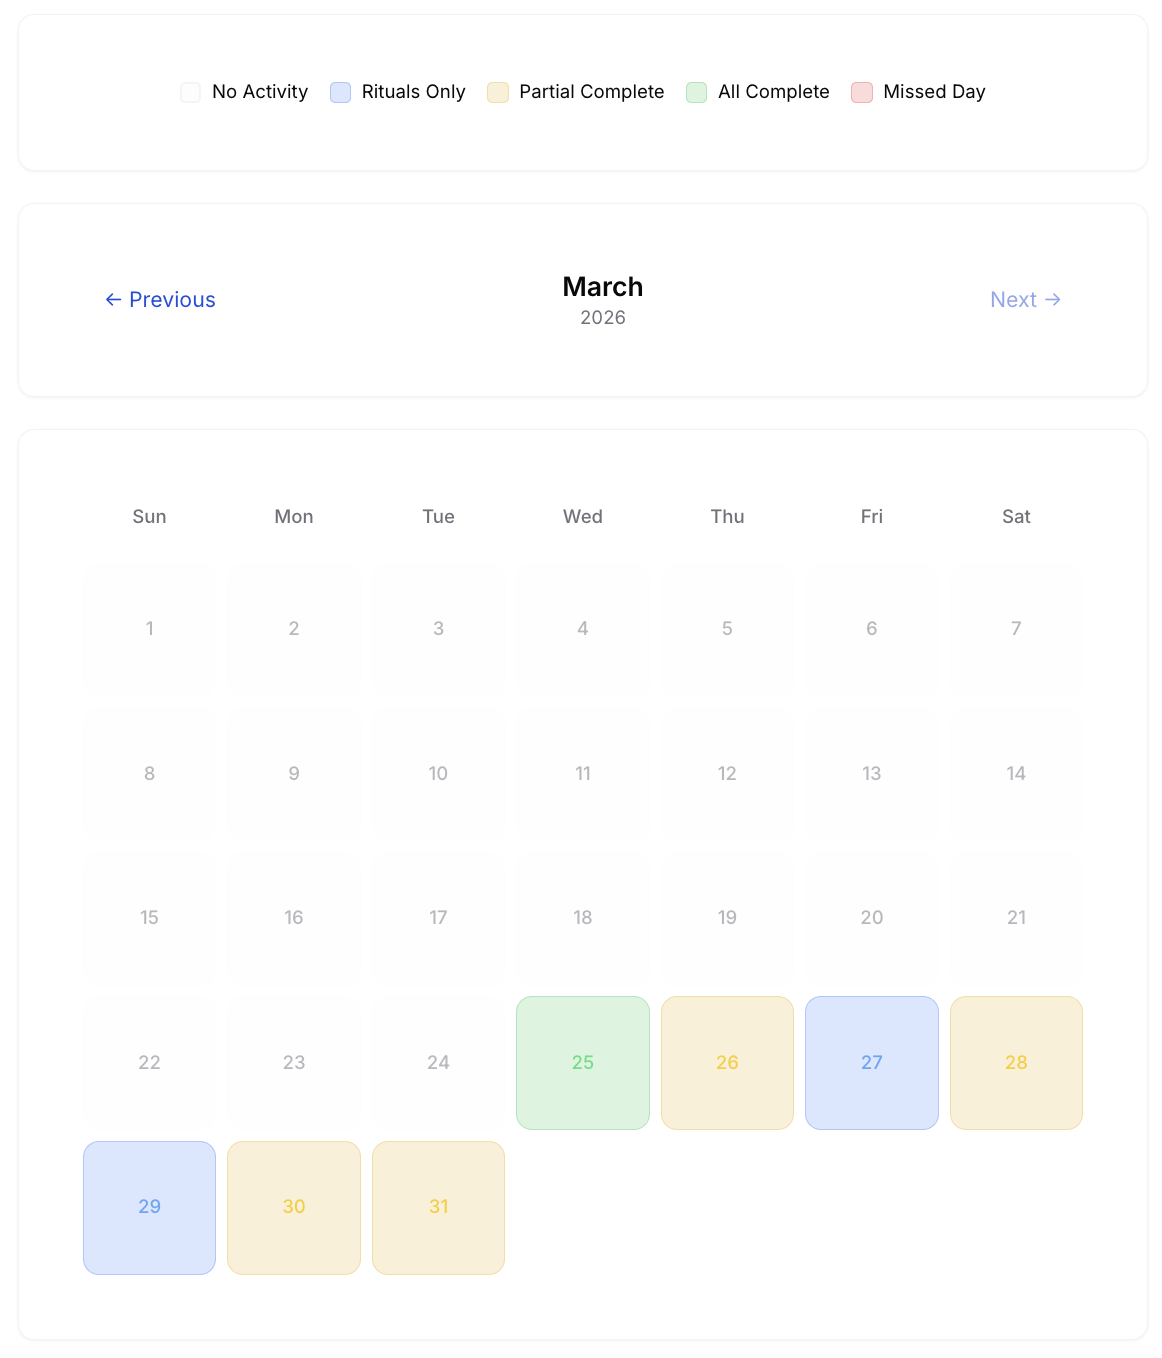
On mobile a toggle switches between the calendar grid and a horizontal timeline view, which makes it easier to scrub through long stretches with one thumb. The colour coding is the same in both views, so patterns are equally visible at a glance: long stretches of strong days look strong, bad weeks are obvious.
Tapping any day opens its detail panel with the rituals that were completed, the daily targets and whether they were checked, and the full text of the discipline log entry you wrote that day. That makes it easy to go back to a specific moment and read what you noted.
How to use it well
Read History at the end of every week. Look at the previous seven days as a unit, not as individual days. A week with five strong days and two missed ones is a good week. Pretending it was a perfect week is more harmful than acknowledging the two misses.
Use the page to spot a particular kind of failure: missing the same day every week, or always failing the same ritual on Sundays. Patterns like that are usually a sign of an environmental issue, not a willpower issue, and they can be fixed by changing the schedule rather than working harder.